navigation logo navigation logo
THERE'S STRENGTH IN OUR NUMBERS.

EnvironmentEnvironment

Environmental Quality

The EQI represents multiple domains of the ambient environmental including air, water, land, built, and sociodemographic. The dashboard shows overall EQI scores for each county, as well as the scores in each domain. The higher EQI scores are associated with lower environmental quality. The EQI helps to understand how health outcomes relate to cumulative environmental exposures that typically are viewed in isolation. It also highlights counties experiencing an increased burden of environmental impacts. The domain-specific indices enable counties to assess the drivers of poor environmental quality in their counties, which could provide a foundation for targeted support to address health concerns tied to environmental quality.


Data Notes  
Definition 
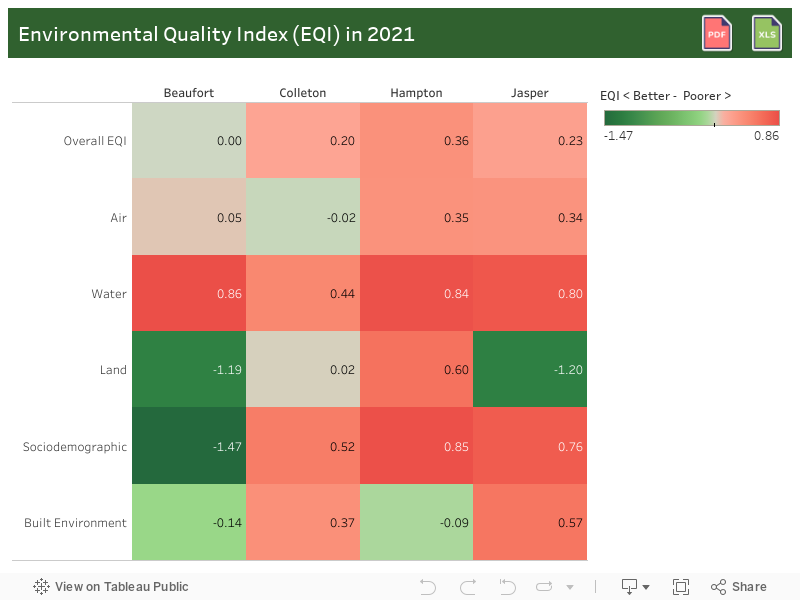
Environmental Quality Index (EQI):  Consisting of five domains (air, water, land, built environment, and sociodemographic).
  • Air:  concentrations of either criteria air pollutants or hazardous air pollutants (toxics)
  • Water:  Overall water quality, general water contamination, domestic use, atmospheric deposition, drought, chemical contamination, and drinking water quality 
  • Land:  Agriculture, pesticides, facilities, radon, and mining activity
  • Built Environment:  Roads, highway/road safety, commuting behavior, business environment, housing environment, walkability, and green space 
  • Sociodemographic:  Socioeconomic, crime, political character, and creative class representation
Data Source U.S. Environmental Protection Agency (EPA), Environmental Quality Index (EQI)
Last Updated April 2024