


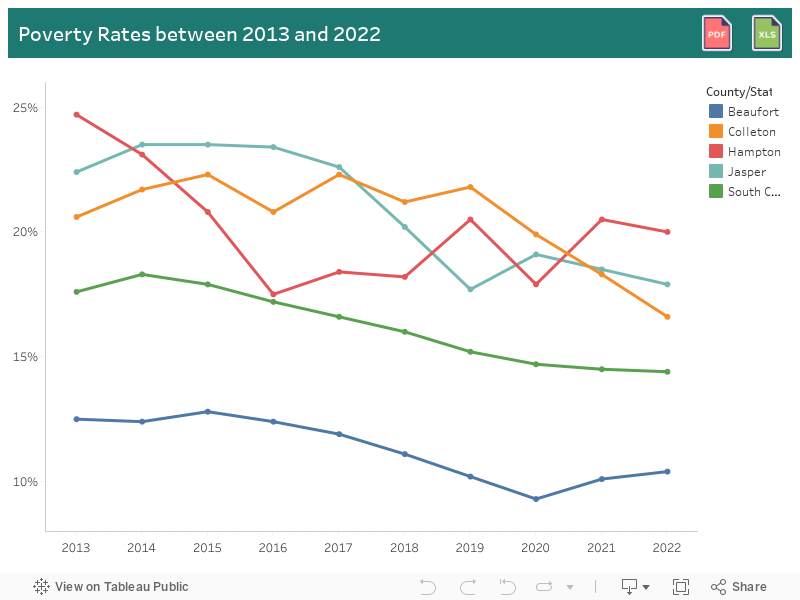
Poverty Rates
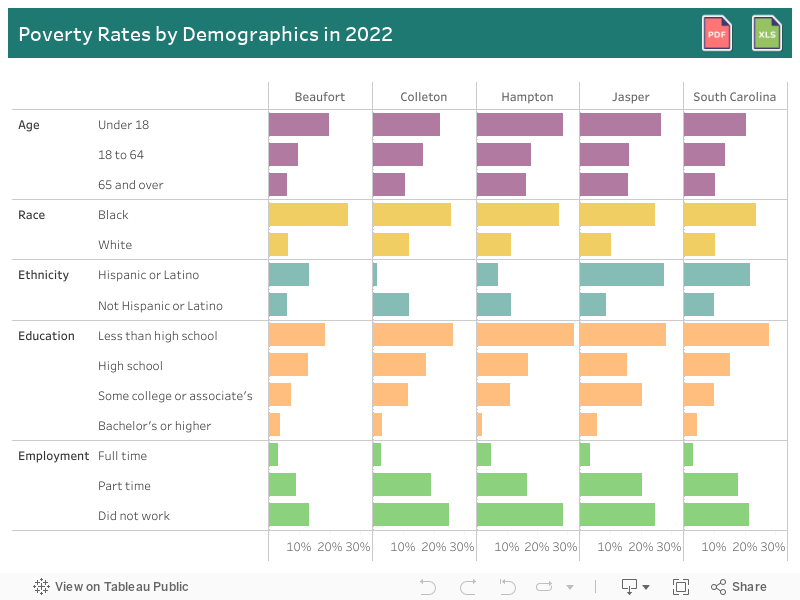
Poverty is not evenly distributed across the region. In the third dashboard, people younger than 18 years old are disproportionately affected, particularly in Colleton County where one in three children live below the poverty level. Race and ethnicity is also a major factor in poverty rates. Across all four counties, Blacks face higher poverty rates than whites. In Beaufort, Colleton, and Jasper counties, Hispanics also face higher poverty rates than non-Hispanics.
| Data Notes | |
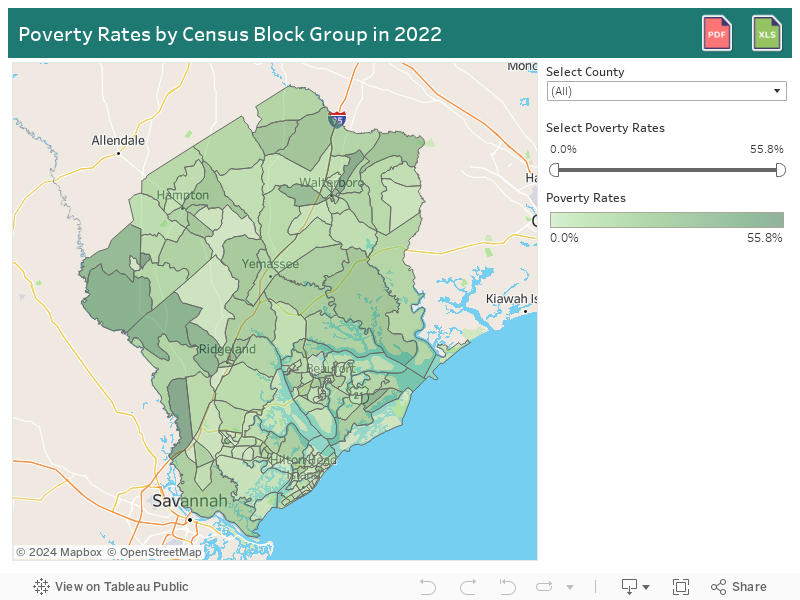
| Definition | Poverty Rates: The percentage of people (or families) who are in poverty. Annual poverty rates are calculated using the sum of family income over the year divided by the sum of poverty thresholds that can change from month to month if one's family composition changes. Census Block Group: A statistical subdivision of a census tract, generally defined to contain between 600 and 3,000 people and 240 and 1,200 housing units, and the smallest geographic unit for which the Census Bureau tabulates sample data. |
| Data Source | U.S. Census Bureau, American Community Survey 5-Year Estimates |
| Last Updated | April 2024 |
