


Traffic Volume
| Data Notes | |
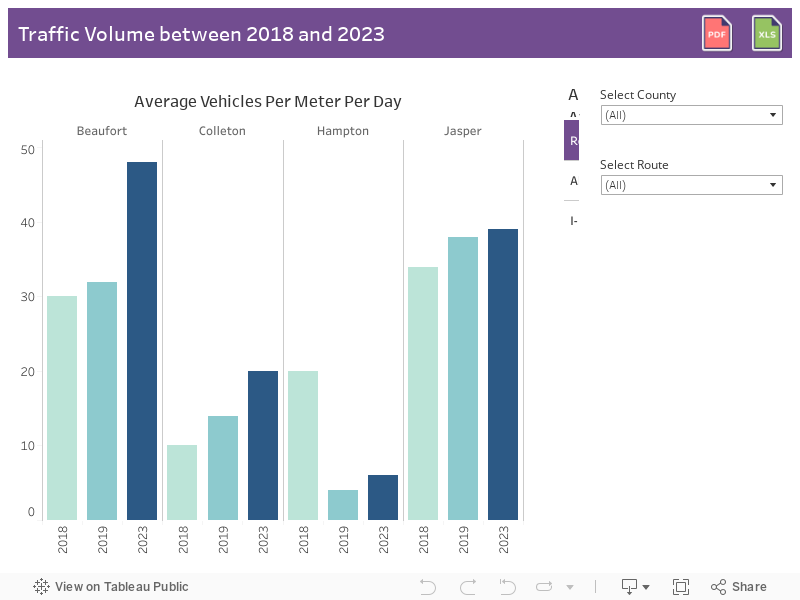
| Definition | Average Vehicle per Meter per Day: The average count of vehicles per meter per day within 500 meters of a census block centroid (the center point of a census block), divided by distance in meters, presented as the population-weighted average of blocks in each county. Annual Average Daily Traffic (AADT): The AADT is the total traffic volume passing a point or segment of a highway facility in both directions of travel for one year divided by the number of days in the year. |
| Data Source | County Health Ranking and Roadmaps (Vehicles per Meter per Day); S.C. Department of Transportation, Traffic Counts (AADT) |
| Last Updated | April 2024 |
